Company growth is one of the main challenges faced by executives. Under this strategy they pursue initiatives such as incorporating new clients, entering new channels, covering new geographies and extending their product portfolio and categories. Combining these strategies has made it difficult for the companies to maintain profitable growth throughout the years.
The importance of portfolio innovation and the trend toward becoming multi-category companies has presented a constant challenge for executives due to the following market conditions: presence of proprietary brands, deeply rooted regional brands, more demanding consumers and smaller players with greater experience in some categories. Along with these market characteristics there are in-house effects that increase the complexity of managing a broad portfolio. This complexity happens at the company level, for example, in the business area, with the salespeople demanding more and more space at the points of sale; in management, by increasing the information that is generated and analyzed in the value chain with an increase in operational expenses. As a result, companies have had difficulties in turning that innovation into profitable growth.
This article will focus in showing the impact of portfolio innovation on the value chain by showing two dimensions: 1) understanding the costs of complexity that each category entails 2) understanding the impact on the company CAPEX. We will show why, when new categories to the portfolio there are not necessarily synergies while there are impact on the cost of serving and the CAPEX requirements. This understanding will help us determine the holistic innovation vision that the company needs to have to be able to achieve profitable growth.
COMPLEXITY COSTS
A partial vision that companies have is that their operating costs are distributed between each product line in proportion to the sales. Assuming that premise can lead the executives to think that by seeking an increase in sales, they will maintain the same level of profitability, or even that it will increase, assuming that there would be a better leveraging of fixed costs.
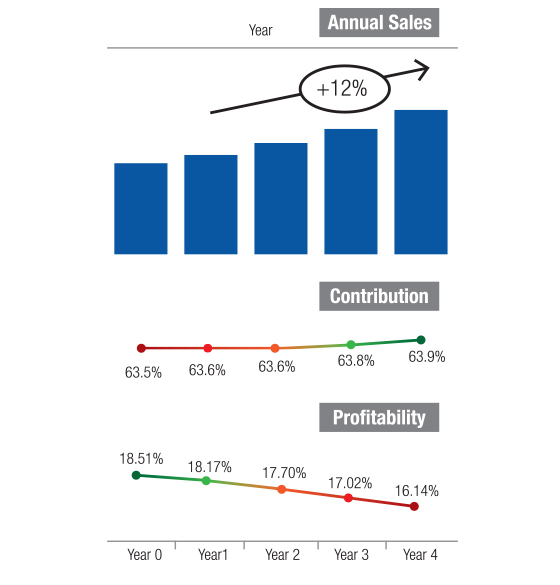
Figure 1 shows that this vision doesn’t always happen, because we can have incremental sales, even with an increased contribution, but not necessarily an improved profitability throughout the operation.
Actually, to see the bigger picture of what happens as the portfolio increases and its impact on profitability, we need to understand whether operating expenses related to the bigger growth categories behave like the average category. To perform this validation we need to consider the performance of the categories at each link of the value chain.
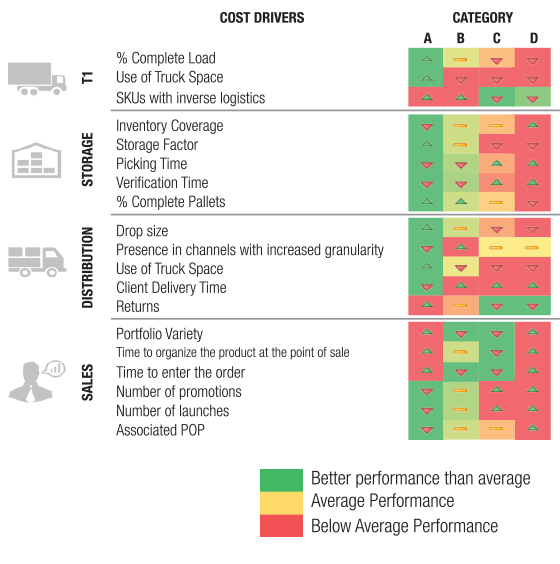
Figure 2 exemplifies some of the points we need to consider to understand the cost drivers of each link of the chain. When the box is green, it means that said category has a better performance as compared to the other categories and, therefore, less complexity and less cost. When it is red, the opposite applies, there is a performance below the average, which means increased complexity and higher costs.
For example, if we take category D in the warehouse link, it shows that these products have high variability, therefore they require a higher inventory coverage, they have more fragile packaging that do not support many piling levels, and they require more time to separate the load, and client orders are more fractioned. These are the main cost drivers of the warehouse, which will imply higher costs for Category D. If we analyze, for example, the sales link, the cost drivers imply that categories with higher complexity and costs will demand more salesperson time to offer the entire portfolio, which will require more time to be organized in the shelves, and which will require more time to enter the order due to the variety of SKUs, and also the ones that have more business and marketing initiatives.
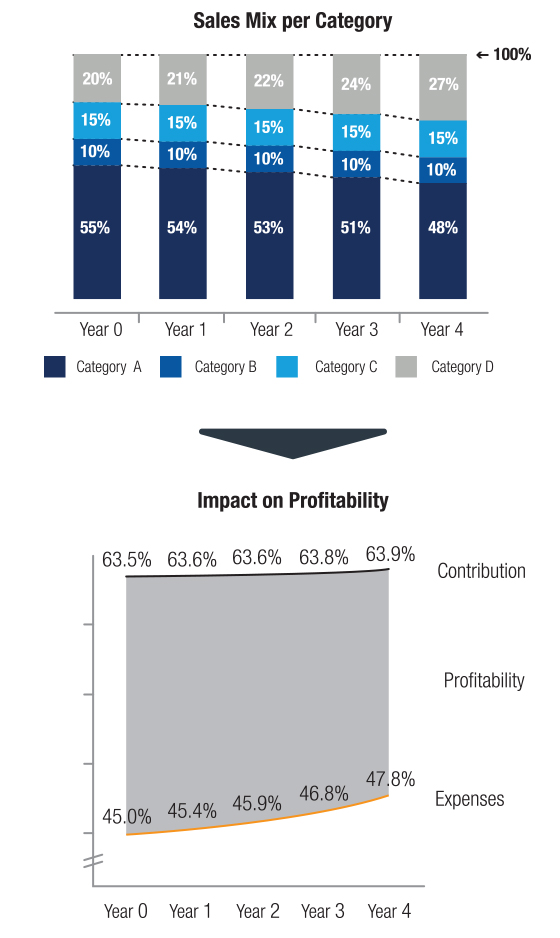
Understanding that type of characteristics per link allows us to have an overview of the consumption of resources per category and, therefore, which category has greater complexity and higher operating expenses. If the categories that are showing the highest growth are more complex to manage and, therefore, they consume more resources than the other categories, then the company will probably experiment a reduction in profitability as shown in 3 where the growth of category D goes from 20% of the total sales to 27% of total sales in 4 years, which involves an increase in expenses and a reduction of profitability.
CAPEX REQUIREMENT
The growth of the portfolio supporting the growth strategy of the companies also has a significant impact on the investment requirement to extend the infrastructure of the operations, i.e., storage capacity at the distribution centers. When the operations are owned by the company, Distribution Centers generally represent 28% of company assets, thus the relevance of understanding the reasons for the increase in CAPEX year to year.
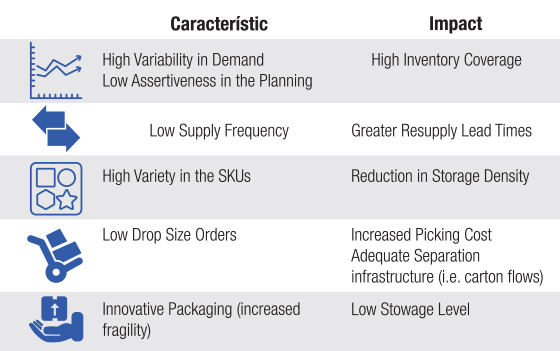
Generally, the products that are added to the portfolio are reduced mobility products, which impacts the capacity requirements of the distribution center due to the following characteristics.
These factors generate an accelerated saturation of the distribution centers, which represents difficulties in the flow of each product within the DC, an increase in operating costs and, finally, increased Capex requirements each year to support the growth in sales.
Another characteristic of these innovation products is their supply origin. They are generally products that are not manufactured internally, i.e., imported items. This adds an additional complexity, because we need to work with greater uncertainties in the chain, the planning processes need to be reinforced throughout the chain, more suppliers need to be developed and the risks of each alliance need to be mapped.
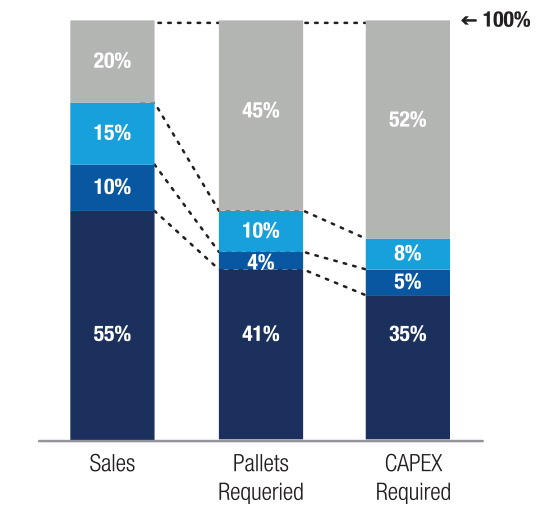
Again, a partial view from the executives may assume that the CAPEX required increases as the company sales increase, assuming that the requirement per category is proportional to the sales. However, as it was mentioned in the above chart, the new categories will require more storage space in proportion to the sales than the categories that are already mature. Therefore, it is common that when we compare the sales with the space and investment requirements we get a vision as seen in figure 4.
Understanding how portfolio growth impacts the investment requirement allows us to differentiate the behaviors of each category and to identify
points in the chain where no synergies exist. With this, we can start to conceive different storage and distribution models, to make every dollar
invested in infrastructure has an adequate return for the company.
RECOMMENDATIONS
This article presents different visions to understand how portfolio growth generates distortions in the value chain and how the complexity linked to the management of a broad portfolio may impact company profitability. The companies that seek a profitable growth and that focus on portfolio
innovation must consider the following 3 points:
1. The management of a broad portfolio demands a segmented vision by product line in terms of sales, expenses and investments to identify
complexity factors in the management of each category. The information added only gives us a partial vision of the performance of the categories
and may result in decisions that privilege a growth in sales, but not necessarily a growth in profitability.
2. The product launch marketing strategy must incorporate a tactical and operational vision of the entire chain to identify potential implications
and to perform an integral evaluation of the feasibility of the products, their lifecycle and their profitability. As part of the launching process, it
is necessary to involve all the participants of the chain to understand the potential impacts on the operation (expenses, CAPEX requirement,
impact on productivity, relationship with suppliers, etc.) and to consider them in the business case of each product to make the launch feasible
and to provide feedback on the target profitability of each category.
3. Portfolio innovation in the companies must be accompanied by innovation throughout the value chain to identify points where there are
no synergies and to generate differentiated and more profitable models to reach the market. For each category we need to ask ourselves if the current supply, storage, distribution and sales platform is the most adequate to achieve the target profitability of the category, starting from
that we will have to innovate and iterate models to serve each group of products based on their nature and complexity to enable profitable growth in each new category.
