Summary
It is not sufficient for revenue to grow; growth needs to be profitable as the essential objective of a business. Growth in a business implies decisions used to focus on investing resources for production and distribution, the allocation of business expenses and the cost of serving different channels — segments and products — services, i.e., having a customer strategy and operations that increase the possibility of growing profitably. Being in a high growth economic sector does not guarantee that a business will experience growth, much less profitable growth. Likewise, being in a falling economic sector is not a synonym for having a drop in income and profitability
Introduction
When there is growth in economies such as Colombia’s, which has maintained a growth in GDP above 4% for 3 consecutive years (2010 to 2012), most of the economic sectors grow; however, not all are equally benefitted within a high growth sector because not all businesses grow equally. Not all business with an increase in income grow profitably, so what makes a business grow profitably? Why do some businesses grow or decrease compared with others in the same economic sector?
Logic says that the higher the income, the higher the operating profits, assuming that they take better advantage of the current capacities and that there are economies of scale that make the costs and expenses remain the same or lower and, therefore, the relative operating profits are higher.
Even though there are financial indicators that reflect the profitability of a business, we will take Operating Income and Operating Profits to be a reflection of a business’ performance and of the economic sector in general. Likewise, the ratio between the Operating Profits / Income reflects the fact that how the business is managed is translated into profits coming in. There may exist other financial profitability indicators; we will use this indicator to simplify and isolate other effects such as financial interest, taxes, and accounting treatment that businesses have to reach a net profit.
Economic Sector Analysis
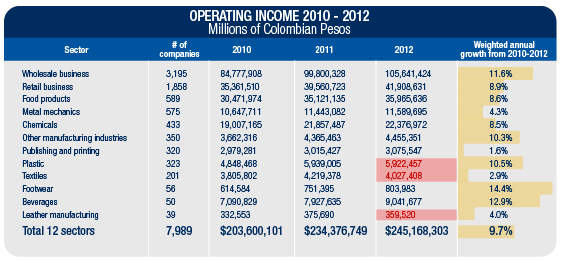
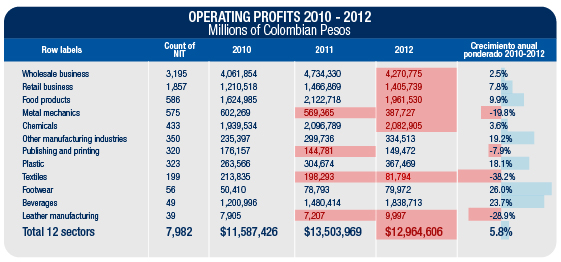
The GDP (Gross Domestic Product) in Colombia grew 4%, 5.9% and 4% in 2010, 2011, and 2012, respectively.(1) This was reflected in increased revenues in many non-primary economic sectors; however, a more detailed analysis showed that not all the economic sectors had similar growth in this three-year period. In one sector, it grew 1.6% (weighted annually) and eight of the 12 had a drop in operating profits relative to income. A sample of almost 7,989 companies in Colombia in the 12 different economic sectors between 2010 and 2012(2) may be summarized in the following table:
- In general, weighted annual aggregate growth in income was 9.75% for the 12 economic sectors; between 2010 and 2011, growth was 15%, but it only grew by 5% in 2012.
- The 12 sectors grew in the three-year period; the sectors with the most growth were Footwear and Beverages with 14.4% and 15.5%, respectively.
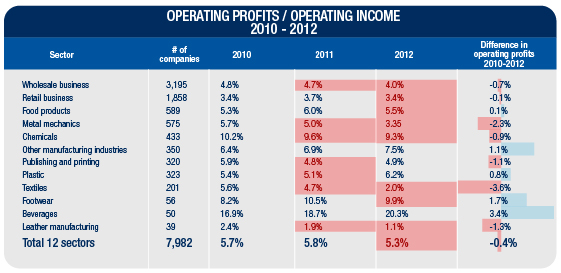
- Unlike Beverages (17.2%) and Footwear (9.9%), the rest of the economic sectors have an operating profit relative to income of just one digit and in one-half (6 out of 12) of the sectors, it is 5% or less.
- The Publishing and Printing and Textile sectors have increased their income marginally by 1.6% and 3.6% weighted annually in the period and were the two sectors that were benefitted the least by the growth in the economy. This demonstrates how difficult the situation is in the sector to adjust to economic opening, changes in channels and new buying habits, especially for books.
- The operating profits relative to income fell in 2012 (highlighted in red) in eight of the 12 economic sectors, showing that the growth in income has still not reached the stage of being translated into greater profits.
- Just two sectors had a growth in the annual operating profits relative to their income: Beverages (+4.4%) and Footwear (+1.7%). The aggregate effect is a drop in operating profits relative to income; the operating profits dropped 0.4% in the 12 sectors.
The following are the main conclusions about growth in the sectors.
- General economic growth does not guarantee that all sectors will grow the same way. There are external factors such as changes in buying, the relative value of currencies (the Colombian Peso vs. the US dollar) and external competition that make sectors have their own dynamics.
- Growth in income does not guarantee growth in operating profits for an economic sector. Certainly, the same factors discussed above undercut the capacity of the whole sector to be able to maintain or grow its operating profits and make it more productive.
If we apply the same analytical logic to companies in an economic sector that has had growth and another with a drop or marginal rise in income: How does the group of companies making up the sector perform? How can this performance be classified? And the most important issue: Why do differences exist in a favorable economic climate with high or low growth?
The Chemicals Sector – High Growth Sector for Income and Operating Profits.
The chemical sector grew at a weighted annual rate of 8.5% for income and is one of the economic sectors with the highest percentage of operating profits (9.3% in 2012). The sector is made up of 433 companies in total.
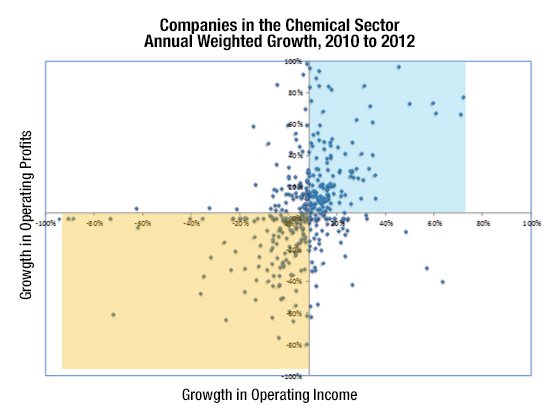
The performance of the different businesses may be summarized as follows:
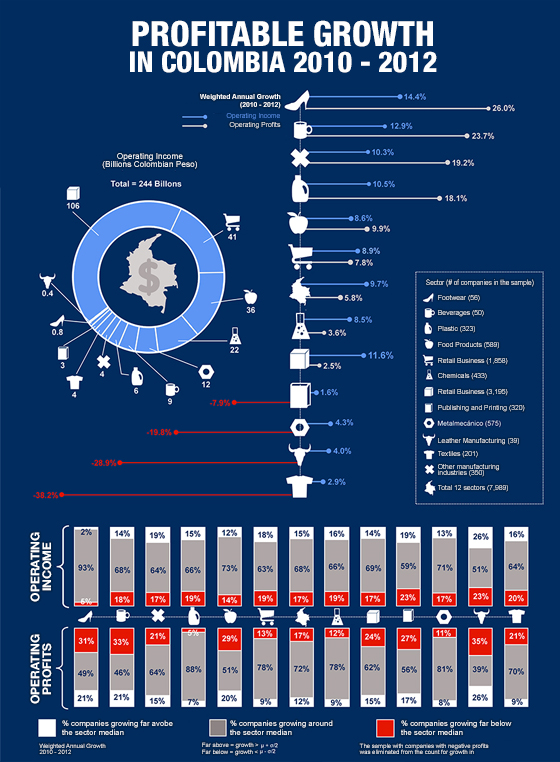
- Only 143 of the 433 (33% – Blue Zone) companies had growth in income and operating profits above the sector average. Just 33% of the companies brought in greater value in the sector compared to the rest. This business group in the sector grew 15% between 2010 and 2012, as the percentage annual weighted rate. This rate is almost twice the average for the sector in the same period and its operating profits grew 29% annually weighted, far above the sector average.
- A total of 150 of the 433 (35% – Orange Zone) companies had performance below the average for income and operating profits. The accumulated growth was practically zero (0.6%) and there was a 20% downturn in annual weighted operating profits.
We are able to conclude that the analysis for this sector involves the following points:
- Even though it is a sector with major growth (+8.5% in annual weighted income), only one-third of the businesses were able to grow more than their competitors by bringing in a greater value generated for sector growth.
- Being in an economic sector with major growth does not guarantee anything; even though there exists a favorable context, there are businesses that watch their income and operating income decline.
The Publishing and Printing Sector – Low Income Growth Sector with a Drop in Operating Profits
The Publishing and Printing sector only grew by 1.6% for income and declined 8% for operating profits (annual weighted percentage) and is the sector with the biggest drop of the 9 sectors in the sample. This sector is made up of 358 companies. Just taking a sample of 183 businesses that make up 95% of the sector’s income, they may be viewed in the following graph.
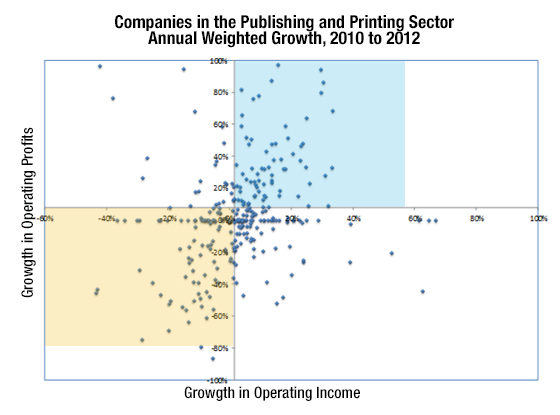
An analysis of the weighted annual growth performance for 2010 to 2012 in income and profits for the businesses in the sector may be summarized as follows:
- Some 36% of the businesses (66 out of 183) had a decline in income and 22% (41 out of 183) in operating profits, clearly showing that the changes in the market, buying habits, and channels is affecting the whole sector in general.
- Nevertheless, a group of 98 of the 183 businesses (54%) did not decline; this whole group even grew 12% between 2010 and 2012. In other words, there is a difference of almost 16% above the sector’s weighted average, growing their operating profits by 39% weighted annually between 2010 and 2012.
- In addition, a total of 22 of the 183 (12%) companies had an extraordinary drop in income and operating profits. They declined 8% and 44%, respectively, in the period. Many of these companies could not offset the market dynamics and especially the sector dynamics.
The conclusions that may be drawn are:
- Even though adverse external conditions exist, a strategy of focusing the business and production resources on the channels – segments and products – services with the highest profitability and/or growth may offset a drop in the market level and even show some growth.
- This sector is fully evolving; certainly, the outlook for a number of companies is going to change in the medium term. It is not true that many companies will be able to hold on for much longer. Logic dictates that the industry must consolidate.
So then, what is the difference?
As we have seen, even in high growth sectors, there is no homogeneous performance by the companies making up the sector. Some of them bring in greater value and vice versa. In a low and even negative growth economic sector, there are businesses that show growth in income and profits.
Regardless of the expectations of the economic sector, all businesses should be looking for a way to guide their resources into the channels – client and product segments – services with the highest growth and profitability. There are three issues that these businesses have in common:
- Focus on the business by segmenting clients, a strategic attempt for each segment and value proposals differentiated by each segment type. The more successful businesses achieve a focus on where the value is in an economic sector.
- Alignment of the processes, information technology, and organization with these segments and value proposals, both commercially and operationally. Clearly, every organization has to plan, execute, and manage based on what the organization has defined.
- Organizational competencies to be developed to be really effective in administering, managing, and improving processes. An organization’s development is based on what the individuals need to learn and unlearn to achieve what the business strategy demands.
In an upcoming article, we are going to analyze the behavior of businesses in relation to different performance indicators and whether there is any correlation between these indicators and growth by the businesses in relation to income and operating profits.
Sources:
(1) Department of National Statistical Management, Colombia (wwe.dane.gov.co).
(2) Corporate Superintendency, the Ministry of Trade and Tourism, Profit and Loss Statement and General Balance Sheet, Accounts from 2010 to 2012 (www.supersociendades.gov.co).
