Introduction
All companies strive to grow their profits. Whether naturally increasing, or by means of acquisitions or mergers, all business enterprises –from small, family-owned businesses to large, multinational corporations —constantly pursue expansion. The main problem faced by such companies is that growth can pose a risk to profitability.
One of the pillars for achieving profitable growth is operational excellence. A properly aligned, flexible chain of production, marketing and resource or service exploitation –operating at optimal levels of both control of overheard and quality of services delivered– can mean the difference between achieving profits and incurring losses. This report will explore the balance between growth and profitability through the lens several key associated operational indicators.
Indicators of operational excellence
There is a wide range of measures for managing and assessing the operations of a company; however, it is not advisable to try to measure or improve all measures indiscriminately because resources can only be stretched so far. Specifically with regard to the productivity chain, SCOR (1) suggests focusing efforts on five key attributes: reliability, velocity, agility, costs and asset management. These measures of a company’s performance can be synthesized as follows:
- Reliability: Service Levels, Perfect Order.
- Velocity: Product Order Cycle Times
- Agility: Flexibility and Adaptability of the Chain
- Costs: Cost of Sales and Logistical Chain
- Asset Management: Inventory Days, Utilization of Capacities, Cash-to-Cash Cycle, Return on Assets
Some of these indicators are measured solely through internal information, but others can be calculated using available financial information. Using this information, the following indicator analyses were carried out:
- Cost of Sales / Operating Income: The ratio obtained from cost of sales over the total operating revenues.
- Inventory Days: A measure of the average time inventory is stocked before being sold. This measure is expressed as Average Inventory / Average Daily Demand.
- Cash-to-Cash Cycle: The measure of the speed with which the business converts cash from the time of buying raw materials to collecting on invoiced sales. It is calculated as follows: inventory days + receivables days – payable days.
- Return on Assets: An indicator of the income generated by the company assets, calculated as losses and profits/total assets.
Performance of growth and profitability by industrial sector in Colombia
Earnings reports for 2010 and 2011 published by the Financial Superintendent’s Office (2) and the Colombian Society of Superintendents (3) were used to carry out this analysis. A sample consisting of 1,236 companies accounting for 80 to 85% of the operating income of 12 economic sectors of the country was examined. The analysis looked exclusively at the country’s largest companies, because small businesses are much less stable. As such, their indicators exhibit wider fluctuations. Moreover, for the purpose of comparisons, an analysis of the financial information of 68 US companies was also effectuated. All of the US based companies examined were listed in the Fortune 500 in 2012 (4) and are the largest publically traded companies for each sector in question.
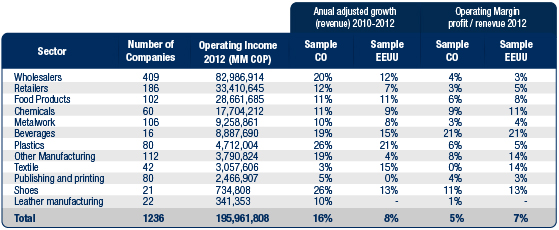
Table 1. Operating income, growth and operating margin of the sample employed: 1236 Colombian companies. Comparison against sample of 68 US companies.
Despite economic and demographic differences between the USA and Colombia, a comparison of these indicators is perfectly valid. The sixty-eight US companies examined are leaders in their respective sectors. It is important to note that companies from different countries but belonging to the same industrial/commercial sector exhibit very similar profitability profiles and performance. Growth is significantly greater in Colombia, which is in line with the country’s overall rate of economic growth.
Performance of operational indicators
Before analyzing the relationship between operational indicators against the results of growth and profitability, one must first analyze the performance of the selected indicators, which vary from sector to sector and company to company. Nonetheless, it is possible to discern general differences that arise from the economic activity companies engage in and the performance characteristics of each industry. Similarly, one can observe operational indicators that are clearly in line with the general growth and profitability trends of several industries.
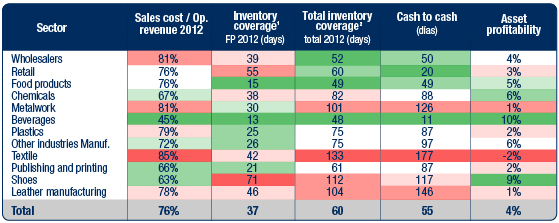
Table 2. Indicators (adjusted average) by sector of the 1,236 Colombian companies selected. Green: Best performing; Red: worst performing.
The textile industry, for example, exhibits the highest rate of costs and stock coverage, longest cash-to-cash cycle and lowest return on asset. These indicators reflect the growth and profitability results, with the textiles sector underperforming all others. This does not mean that all of the companies exhibited poor performance, but in terms of the sector these results send up many red flags.
In terms of finished product or total inventory, the analysis of stock coverage exhibits the greatest variances from sector to sector. This phenomenon is closely linked to economic activity. For example, productive sectors have raw material and packaging stock coverage issues that commercial sectors have only in lesser degree, while in the manufacturing sector the ratios of finished product inventory to total inventory is largely a function of the supply chain strategy deployed in each company and the general practices of the sector. Under Make to Order (MTO) or Assemble to Order (ATO) schemes, finished product stock coverage is diminished, consisting only of sold merchandise or that which is in the process of delivery.
The Cash-to-Cash Cycle, which takes into account total inventory, receivables and payables, varies as a function of the balance between these three factors. For example, the Beverages and Retail industries exhibit the fastest cash-to-cash cycles, largely because these industries have reduced client bases and extend very little credit to clients. Moreover, the terms imposed for payment to suppliers are the lengthiest of all industries.
The relationship of operational indicators to growth and profitability
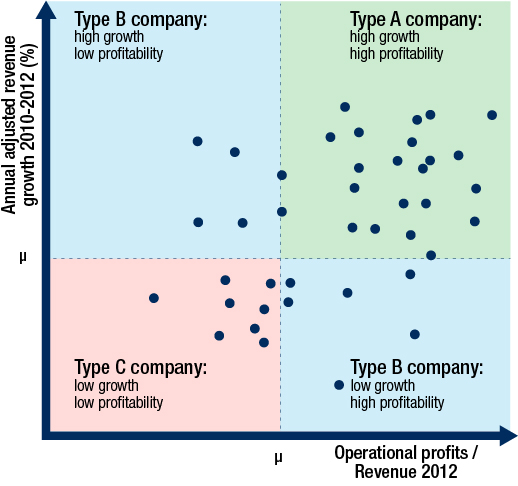
In order to analyze the link between operational indicators and earnings, the sample companies were classified as per growth and profitability. A company is deemed to have high growth if it stands above its sector average. In this way, there are Type A companies, exhibiting high growth and high profitability; and Type B companies, with high growth and low profitability and vice versa; while Type C companies are those with low growth and low profitability. (Chart 1).
Chart 1. Classification of companies by growth and profitability
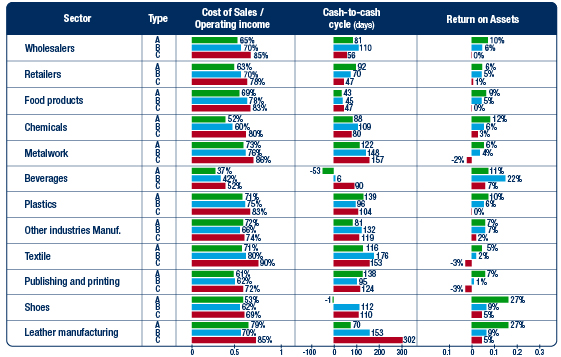
This classification allows the analysis of the diverse indicators by company type and sector, with a focus on key business metrics: Cost of Sales / Operating Income, Cash- to- Cash Cycle and Return on Assets (Chart 2).
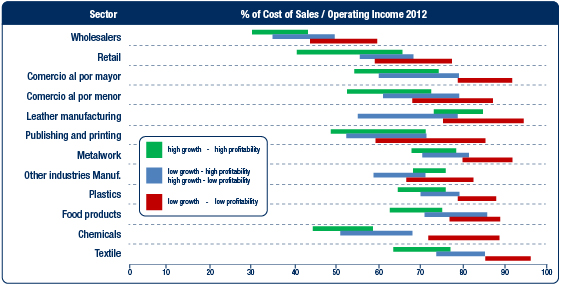
In 10 of the 12 sectors analyzed, Cost of Sales /Operating Income was closely correlated with the type of company, coming in highest for Type C companies exhibiting low growth and low profitability. This was less closely correlated for Type A companies exhibiting high growth and profitability. From this observation, one cannot conclude a cause and effect, since there are many other factors that contribute to earnings, but the tendency is clear; i.e., companies that grow and reap profits seem to exercise more discipline with regard to controlling costs than competitors of similar size.
Chart 2. 2012 indicators by sector and company type: (A: high growth and high profitability; B: low growth and high profitability (or vice versa); C: low growth and low profitability)
In addition to analyzing in terms of averages, we carried out an examination of the distribution of each indicator by sector. From sector to sector, cost of sales exhibits different degrees of variability, results which also overlap in companies of different types. (Chart 3).
Chart 3. Distribution of % of Cost of Sales / Operating Income 2012 (35% by sector by company type)
The second indicator analyzed is the Cash-to-Cash Cycle. Because of its link to cash flow requirements, one would expect companies with fast or negligible cycles to exhibit higher growth and profitability. The performance of this indicator is less consistent than that exhibited for Cost of Sales percentage across the several sectors. This can be explained by the fact that even though a short cash-to-cash cycle is generally desirable, it can also be counterproductive. Short cash-to-cash cycles because of tight inventories can indicate poor inventory management, which can also undermine quality of service. Similarly, carrying high levels of accounts payables (which also shortens the cash-to-cash cycle) may be an indicator of trouble with suppliers, something that can affect the entire productivity chain.
In all events, at least in half of the sectors, the Type A (high growth-high profit) companies exhibit shorter cash-to-cash cycles than Type C counterparts (low growth and profit). Likewise, an examination of all companies, without regard to sector, shows Type A companies operating under a cash-to-cash cycle that is 41 days less than that found in Type C companies. (Chart 4)
Chart 4. Cash to cash cycle of the total sample by business type
Finally, Return on Assets performed in line with company type. Type A companies tend to enjoy higher returns on assets. This result is consistent with expectations up to a point, since profitability itself is a classification criterion, though expressed alternately as operating margin/revenue. This is, however, only one of two classification criteria, the other being growth. An examination by sector shows that the Type A companies have on average higher Return on Asset than Type B companies, while the latter outperform Type C companies, with the notable exception of the Beverage sector, which is the most consolidated sector of the sixteen under analysis.
Conclusions
The operational end of a company is a critical factor in achieving profitable growth. To evaluate the relationship between operational indicators and growth/profitability, we examined the earnings reports of 1,236 Colombian companies that account for 80 to 85% of the sales in their respective sectors. From sector to sector, the indicators analyzed show a diversity of correlations with the growth, but on average the lower growth and profitability industries consistently underperformed in the operational indicators.
An industry by industry analysis of the selected indicators shows that Type A companies have on average lower Cost of Sales/Income, shorter Cash-to-Cash Cycles and higher Return on Assets. Examined by industry, these indicators allow us to estimate the growth and profitability performance of a given company, especially within sectors grouping companies with the most similar business activities, such as Textiles and Beverages. In those sectors exhibiting greater diversity in the business activities of their constituents, such as Wholesalers, Food and Manufacturing, the results of the selected indicators exhibits less correlation to the performance of growth and profitability.
From the perspective of operations, a company that wishes to achieve profitable growth must have deep knowledge of the performance of its productivity chain in order to grasp the opportunities it contains. The findings reported herein provide an introduction to this matter using public information. Internal indicators, such as service levels, product order times, logistic chain costs and utilization of capacity certainly can provide an even deeper understanding of these issues. Using these indicators with a mind to identifying key opportunities, a company must align its productivity chain under an Operational Strategy that allows it to provide its target market with the highest level of service that is, moreover, flexible and delivered at the lowest cost.
About Sintec
Sintec is a leading consulting firm in the field of generating profitable growth and developing competitive advantages through the design and implementation of Integrated, Innovative Client and Operational Strategies. Sintec employs a unique, robust methodology aimed at developing business competencies based on Organization, Processes and IT. Sintec has successfully completed more than 300 Commercial, Operations and IT strategy projects in no less than 100 leading companies in fourteen countries in Latin America. With twenty-five years in the consulting field, Sintec can claim the mantle of the region’s most experienced business consulting firm.
References
1. Supply Chain Council. Supply Chain Operations Reference Manual. [Online] 08 2010. http://supply-chain.org/f/SCOR10metrics.pdf.
2. Superintendencia Financiera de Colombia. Sistema Integral de Información del Mercado de Valores. [Online] 2012. http://www.superfinanciera.gov.co/reportes/Simev.html.
(Colombian Financial Superintendent’s Office. Stock Exchange Integrated Information System)
3. Superintendencia de Sociedades de Colombia. Sistema de Información y Riesgo Empresarial. [Online] 2012. http://www.superfinanciera.gov.co/reportes/Simev.html.
(Colombian Superintendents Society. Business risk Information System)
4. Fortune 500. Fortune 500 2012. [Online] 05 21, 2012. http://money.cnn.com/magazines/fortune/fortune500/2012/full_list/.
