Introduction
One of the essential abilities for any modern organization is, without a doubt, the leveraging of its information to improve the results of the business. It is increasingly inexpensive to store and to process information, capacities that are within reach of practically all companies, but it is also true that few manage to achieve excellence in the effective use of the available information. Retail is one of the industries that is most affected by the poor use of information. In this article we will show how to use “Market Basket Analysis,” an analysis methodology for capitalizing a retailer’s sales information and turning it into better margins, increased sales and more traffic at its points of sale.
What is Market Basket Analysis?
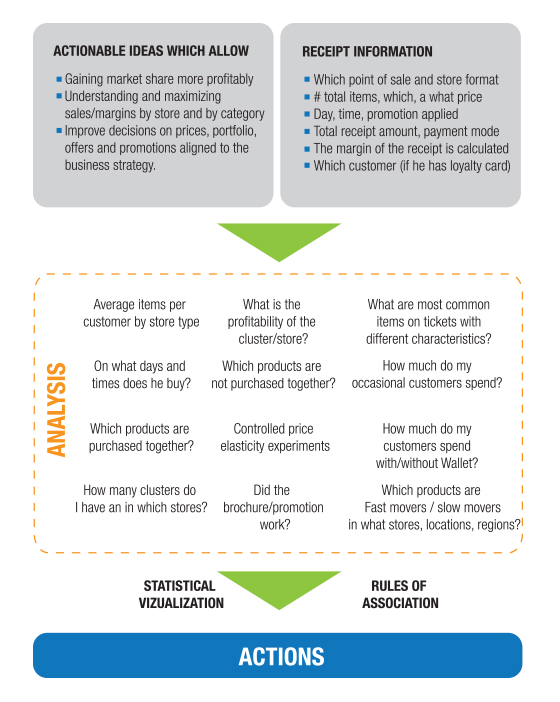
It is a mathematical analysis for finding patterns in the information of sales receipts of a set of stores, during a certain period. A retail chain generally keeps several months of history of the information of its receipts.
This information includes:
• Point of sale of the transaction
• Date of the transaction
• Time of the transaction
• Number of articles
• Description of each bought article, with its price and discount or
applied promotion, if applicable
• Amount of each article purchased
• Total value of receipt
• Mode of payment
• Membership to loyalty card of the store, if there is one
With the identification of each item, is possible to associate its route in the commercial hierarchy of the retailer (department, class, family, sku) and, depending on the costing strategy used, an estimated margin can be associated per SKU and receipt.
What Questions can help to respond to Market Basket Analysis?
Market Based Analysis focuses on improving 3 main areas of the operation of a retailer:
1. Effectiveness of prices and promotions and their means of communication (pamphlets, coupons, etc.)
2. Portfolio and supply
3. Planogram and arrangement of the product in the point of sale
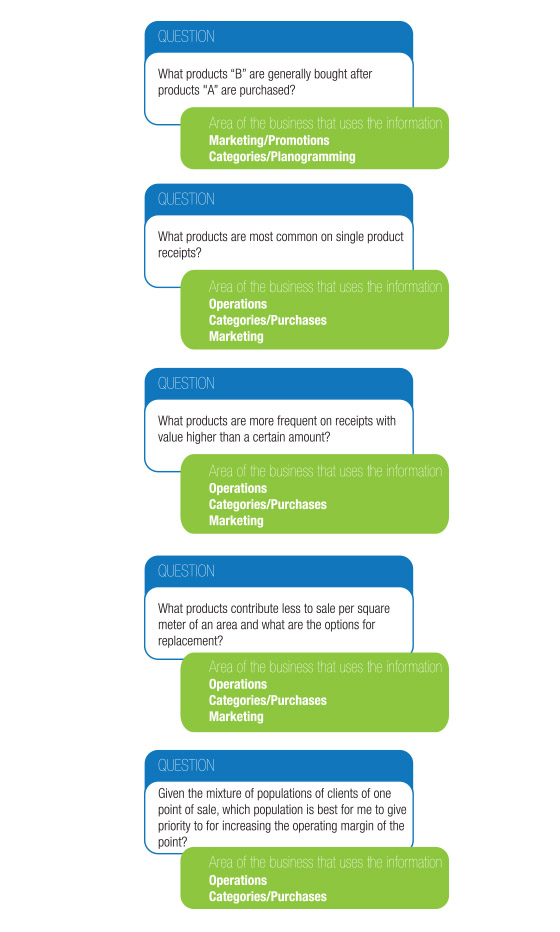
The idea behind the analyses is to generate concrete and measurable actions to improve the results of each point of sale. Some questions are illustrated below.
Effectiveness of promotions
Market Basket Analysis helps to clearly understand how customers are responding to different promotions, without ambiguities. The comparative effectiveness can be evaluated for promotion of discounts, 2×1, bundles, among others, and it can be determined which set of products/promotions produce better results in traffic generation, margin increases, switching of brands, etc. With the identification of affinity rules, products are identified whose sale has different levels of correlation with other products and it is determined which will be promoted, for example, due to being present in baskets of high value and of evaluating the impact on the subsequent average receipt.
The commercial area can also identify when a promotion is having an effect contrary to that which is desired, for example when discounting a product for the purpose of generating traffic and recovering margin with additional articles, and discovering that the discounted product is mainly a component of low-value baskets. It is also possible to influence the purchase of comparable products with higher margins, through coupons designed specifically for each customer as a function of his buying pattern. In retail transactions at the counter, for example in the case of pharmacies, is possible to give to the dispatcher specific suggestions for seeking cross-selling and up-selling in real time while the customer is served.
Portfolio and supply
Market Basket Analysis contributes valuable evidence for determining the effectiveness of the portfolio and supply of a point of sale.
What products have zero or slow movement? Which of them are slow but are present on the majority of high-value tickets? How should the point of sale be prepared to guarantee supply in specific seasons/ categories? These questions can be answered clearly and easily, providing actionable information to the purchasing department and category management for activities of purging catalogue and seeking alternate products, especially those which are seasonable, promotional and in general classified as not re-supplyable.
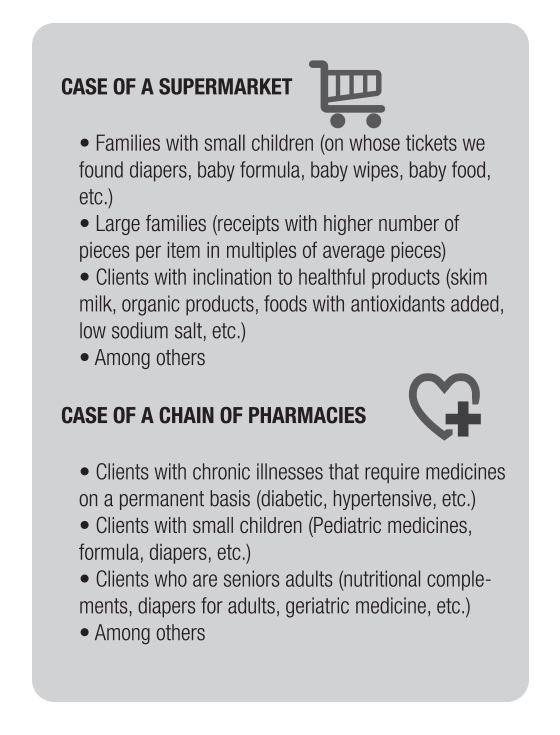
The Basket Analysis can identify subgroups of populations among the habitual clients of a point of sale. For example, it is possible to identify, for one point of sale, how many clients belong to groups such as:
This information is used for calculating the average profitability of the group in comparison with the average of the rest of the clients of the store, the frequency of receipts of the group per period, the average items and value per receipt of the subgroup, and taking actions which are determined for adjusting the supply, portfolio and promotions for each group so that there is an increase in traffic, average receipt and average margin.
Planogram and arrangement of the product in the point of sale
Finally, Market Basket Analysis produces valuable information on the effectiveness of different designs of planograms and suggestions for their adjustment. What products are advisable to position together to stimulate cross-sales? What products are most present on single item receipts (which generate traffic) and how advisable is it to locate them at the back of the store to take advantage of this characteristic? By means of the aforementioned affinity analysis, the “B” products are determined that are advisable to place in locations adjacent to “A” products to stimulate their rotation. By carrying out different store modification exercises in stores with comparable purchase patterns, the design of the planogram can be determined which produces best sales results per square meter for the department in question. Likewise, depending on the relevance that is granted to clusters of buyers that form the base of clients of each store, decisions can be made to adjust floor plans to dedicate more or fewer square meters to different departments.
The analysis is only half of the story
The market basket analysis is only part of what is required for achieving business results. Considering that obtaining the capacity to process the large amount of data implied by a MBA is sufficient to justify the effort is a serious, and unfortunately common, error. In order to obtain sustained results it is necessary to create an organizational skill. This goes beyond buying tools and hardware. In order to establish a skill in the company, three elements are necessary:
Technology
In this category, the following requirements are highlighted:
1. The capacity to run the queries to provide receipt information to the analysis process. This implies programming the data queries and connectors and allocating the processing time and storage space for periodic execution.
2. The programming of the algorithms for analysis of affinity and descriptive statistics on the equipment that will execute this functionality.
3. The acquisition of the necessary licenses for the execution of the analyses. This can range from acquiring specialized software such as SAS, modules of SAP and ORACLE, among others, to carrying out the programming with relatively low-cost resources such as Rapid Miner or open source code such as “R.”
Processes
Highlights of this section are the processes related to the interaction of the analytical area with the people in charge of purchases, marketing, category management and operations, mainly in the store. The processes must make clear the level of service to achieve for each type of decision. It is necessary to define:
1. What analyses require what type of information, with what time horizon, which cutoffs and purges are required, etc. What are the times for execution and the distribution lists of results? What will be the dynamic of the detailed explanation for the users of results, etc.?
2. The prioritization or model of government of the capacity of analysis. How is the work of the team going to be prioritized, which decisions are priority.
3. The responsibility of the “customer” areas (purchases, operations, management of categories, marketing, etc.) for use of the information derived from the analyses in the execution of clear actions, the measurement of the results of these actions and the dissemination of lessons and continuous improvement.
4. Which Indicators shall be kept on a continuous basis and with what objectives per period.
Organization
The adjustments to the organization are a fundamental subject and due care should be taken to guarantee a successful operation. It is important to focus on and assure the following:
1. The profiles of the analysis team: Defining and finding these profiles are a critical point for the success of a Market Basket Analysis initiative. Ideally, people are sought that have a quantitative facility to understand the analysis algorithms designed, but also, and this is fundamental, that have very good knowledge of the business. The capacity of interaction of the team must allow it to also interact with technical personnel who handle the data queries and also with the directors who will use the analyses to execute business actions.
2. The area where the analysis team will be located. Here the options are the commercial area, the operational area and the IT
department. The decision on where it is most advisable to house this capacity depends on the focus that the organization wants to adopt for its use and on its current structure. It is generally in the commercial area where the skill is most leveraged, because in general that where the function of purchasing, category management and supply and the central function of the planogramming and space management are located.
3. Regardless of where the analytical area for Market Basket Analysis is housed, the following four roles are defined:
a. The owner of the data: This is the person that will assure the quality and availability of the required data.
b. The owner of the analyses: For each analysis, the person who takes responsibility for the results must be clear, seeking to specialize functions.
c. The owner of the decision: It is the definition of the user of the analyses who decides the actions to undertake to modify the results of the business.
d. The owner of the action: This is the person in charge of executing the initiatives derived from the analysis and the decision made.
In conclusion
Market Basket Analysis is an effective resource on the path towards the leveraging of retail the available information in retail environments. Its appropriate use benefits results of sales, margins and generation of traffic in points of sale. For its implementation, it is possible to start with precise and defined initiatives on the decisions to improve with the analysis, using lowinvestment tools. Once there is a basic understanding and use, larger investments in more robust technology can be considered, with greater confidence that this investment will be reflected in improved results for the organization.


